

Harness Half-Life: A Field Playbook for Catching Agent Decay
The harness engineering discourse names what to build. The Model Reliability Engineering arc names how long the build lasts, what kills it, and what to do at week six.

TL;DR - Your agent worked last month. It doesn’t today. The model behind it changed, the inference stack underneath it was swapped, a downstream API quietly updated its tool schema, or special-case branches piled up inside the harness itself. The harness’s behavioral effectiveness against its original validation baseline has shifted, and the shifts compound.
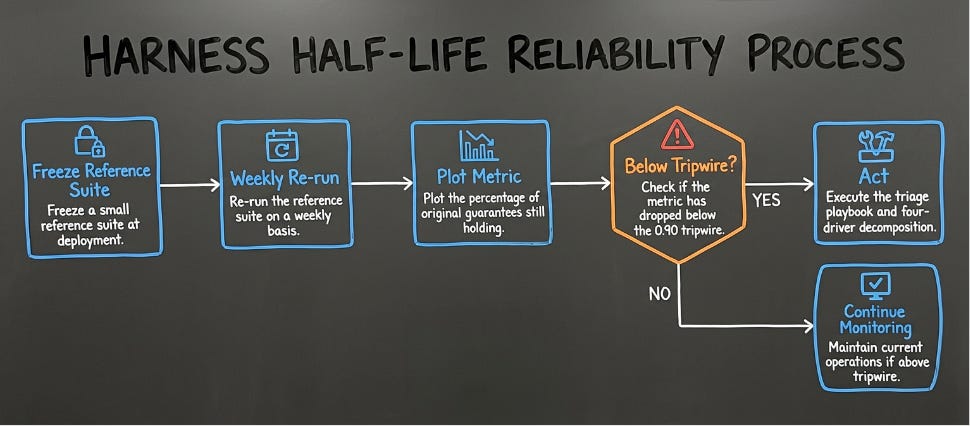
Harness Half-Life is the Model Reliability Engineering metric for catching that shift before a customer does. The playbook is short: freeze a small reference suite at deployment, re-run it weekly, plot a single number (the percentage of original guarantees still holding), and act when the number drops below your tripwire. Field-tested teams cross the 0.90 tripwire in four to twelve weeks; the formal half-life (50% guarantees lost) typically arrives only after a team has neglected the curve through multiple driver events. This piece is the four-driver decomposition, the triage playbook, and what to tell your customer between week zero and week six.
What is Harness Half-Life?
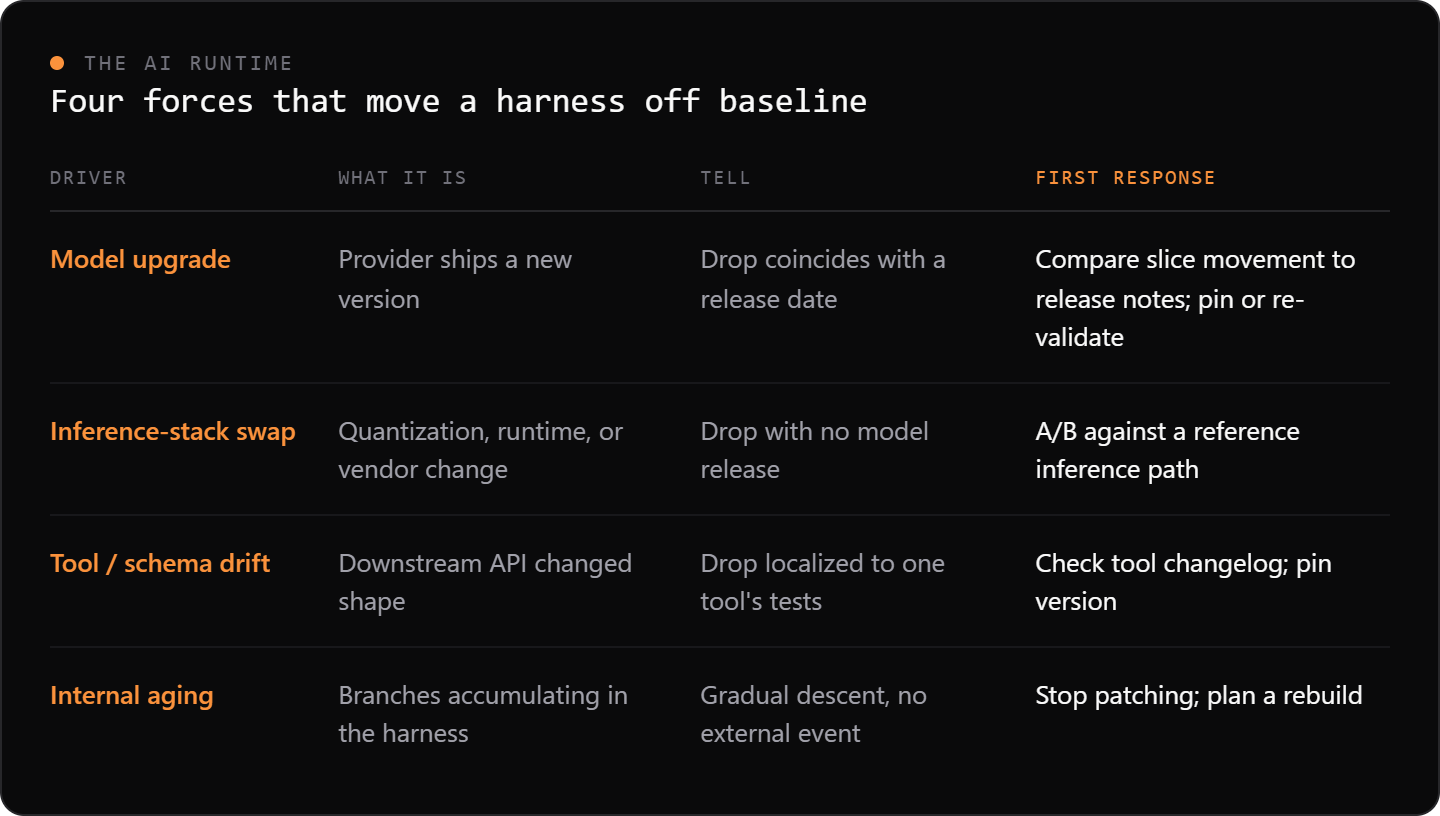
Harness Half-Life is the period after which a deployed harness loses half its behavioral effectiveness against its original validation baseline, driven by four independent decay forces operating in production: model upgrades, inference-stack swaps, tool and schema drift, and internal aging.
The metric sits inside the Harness Engineering pillar of Model Reliability Engineering.
Why agents decay
The harness engineering discourse — OpenAI’s formalization post, LangChain’s anatomy breakdown, Anthropic’s two essays on long-running agent harnesses, a recent Hashimoto writeup on agent harness adoption, our coding-agent harnesses and HumanLayer’s “Skill Issue” framing - converged in early 2026 on a shared model of what a harness contains. With the canonical equation Agent = Model + Harness.
What none of that work tells a production team is how to catch a harness when it starts failing. That is the Harness Half-Life chapter of Model Reliability Engineering. The closest existing usage of a decay term is a per-component “harness half-life” framing, which addresses component-by-component obsolescence as models improve; that framing sits cleanly inside the model-upgrade driver of the broader four-driver decomposition below.
Anthropic’s engineering team comes closest to naming the underlying pain in the managed-agents post. A harness component bakes in a compensation for some specific limitation of the underlying model, and as the model improves that compensation can stop matching what it was designed for. The concrete example: a context-reset mechanism added to handle Sonnet 4.5’s habit of wrapping up tasks prematurely became unnecessary on Opus 4.5. The harness didn’t break. It just no longer matched the model.
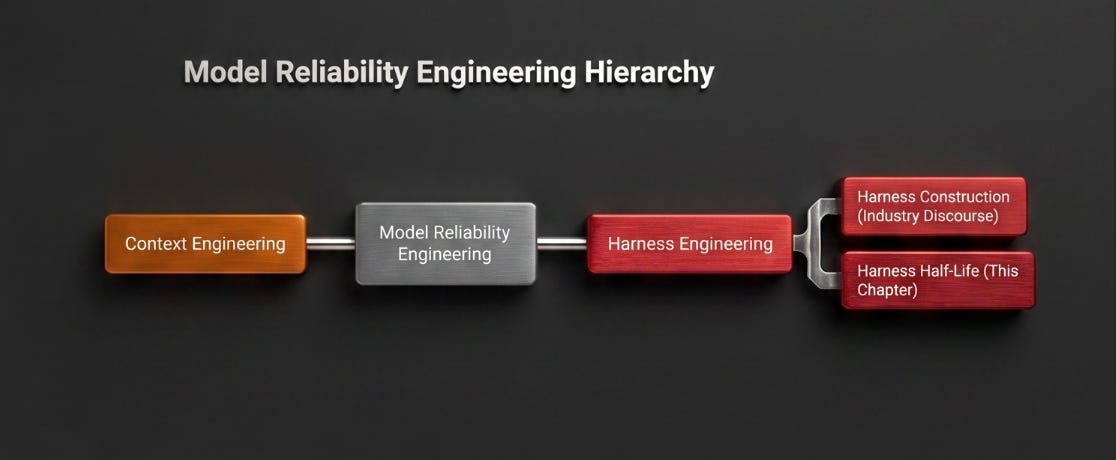
Harness Half-Life sits inside the Harness Engineering pillar of Model Reliability Engineering. Harness Engineering is what the industry has named; Harness Half-Life is the measurement the industry has not.
The four drivers, plainly
Four forces move a deployed harness off its validation baseline. Each one has a tell, and each one has a different first response.
The reliability score and tripwire
Take the percentage of a frozen reference suite that passes at deployment. Call that 100%. Each week after deployment, re-run the suite and divide the week’s pass rate by the deployment pass rate. The result is the reliability score, a single number per week, starting at 1.0 and descending.
(For the academically inclined: this is a normalized survival function borrowed from reliability engineering. The math underneath is one line; the discipline of running it on a cadence is the actual work.)
Three zones on the curve are operationally meaningful.
Zone Reliability score What you do Green > 0.95 Standard monitoring cadence Yellow 0.7 – 0.95 Investigate which driver moved; budget a re-validation Red < 0.7 Stop shipping new features; rebuild or hard re-validate
The line between yellow and green is your tripwire. It is a configuration choice, not a universal constant.
Context Tripwire Reasoning Regulated, customer-trust-critical 0.95 Trigger on the first real drop Standard production 0.90 Allow 10% guarantee erosion Internal tools, cost-optimized 0.80 Accept higher tolerance for lower cadence
Field-tested teams cross the 0.90 tripwire in four to twelve weeks. Variance across teams is enormous; variance for a single team across consecutive deployments is much smaller. After two or three deployments a team learns what its own curve looks like.
The triage playbook
When the reliability score drops, the team has hours to attribute the cause before someone files a P2. Four moves in order, fastest to slowest.
Move 1: check the calendar. Did the drop coincide with a frontier-model release, a tool provider’s changelog entry, or an infrastructure change the team made? Maintain a shared annotated timeline of these events from the start of every deployment. Most drops resolve at this step.
Move 2: slice the suite. Which categories moved? The pattern of slice movement points at the driver before any code runs.
What you see Most likely driver Big jump in refusal-category or structured-output failures Model upgrade Many slices each move a little, no model release Inference-stack swap One tool’s slice tanks; the rest stay flat Tool / schema drift All slices descend gradually, no event Internal aging
Move 3: roll back one thing. Re-run the failing prompts against the previous model version, the previous tool schema, or the previous harness commit. Whichever rollback restores the failing prompts identifies the source. Keep these rollback configurations runnable on demand. That is a discipline more important than any specific monitoring tool.
Move 4: A/B inference paths. If moves 1 through 3 are ambiguous, run the same prompt against the current inference stack and a reference FP16 stack. Token-level divergence on previously-passing prompts isolates inference-driven decay, the silent class that doesn’t show up in any benchmark.
A complete triage runs all four when needed. Most production incidents resolve at move 1 or 2.
The four drivers, deeper
Each section below adds the texture and citations the triage playbook glosses over.
1. Model upgrades
A frontier-model release changes what the harness sits on top of. Refusal patterns shift. Tool-call distributions move. Structured-output formatting changes. Default verbosity moves. A harness regex tuned to Sonnet 3.5 outputs may match nothing on Sonnet 4.5. A guardrail that fires on a particular phrasing may stop firing.
Anthropic’s engineering writeup documents this candidly. A harness modification added to compensate for a Sonnet 4.5 behavior became unnecessary on Opus 4.5, because Opus didn’t exhibit the behavior. The companion article on harness design confirms the pattern across iterations. Lessons from earlier-model harness work explicitly didn’t carry forward unchanged.
The footprint on the curve is a discrete step drop coincident with a release. The step size depends on how tightly the harness was coupled to specific model behaviors. Loosely coupled harnesses (string-tolerant validators, behavior-agnostic routing) show small steps. Tightly coupled harnesses (regex extraction, phrase-specific guardrails) show large ones.
The fix is not to avoid upgrading. The fix is to pin model versions explicitly in production, treat each upgrade as a re-validation event, and pay the validation cost on a planned schedule rather than an unplanned one. Across publicly observed Anthropic, OpenAI, and Google releases, a frontier-model release ships roughly once a quarter per provider; the Anthropic release calendar alone makes this cadence visible to any production team that watches it.
2. Inference-stack swaps
This is the underrecognized driver. A “lossless” inference-stack change, switching to a quantized variant, moving to a new serving runtime, adopting an inference-optimization vendor, looks like an infrastructure choice and lands as a behavior change.
Inference optimization is genuinely valuable. Decode latency is memory-bandwidth bound, AI chip compute has outpaced memory bandwidth roughly 4.7-to-1 over the last decade, and every serious vendor ships some form of compression. The trouble is that “lossless” means different things to different vendors. QuaRot’s 4-bit LLaMA2 result retains 99% of zero-shot performance. NVFP4 recovers 95-99% of BF16 accuracy depending on model size. Together AI’s Blackwell guidance markets near-lossless quality. A new entrant, Isiro Labs, claims bit-exact preservation while reducing the bytes inference moves over the bus.
What matters in the field: a benchmark-equivalent stack swap can still flip the argmax on out-of-distribution structured outputs the benchmark suite never covered. A function-calling harness that hits a specific branch when the model emits a particular JSON key may stop hitting that branch after the swap, even if MMLU scores are identical. Most production teams attribute these drops to upstream model regressions and complain to the model provider, who responds (correctly) that nothing on their end changed.
The footprint is the easiest to miss. Many slices each move a small amount, with no external model release on the calendar. The fix is to never deploy an inference-stack swap without an A/B reference path running against a known-good stack for at least a week.
3. Tool and schema drift
Tools are not stable. Downstream APIs change schemas, deprecate fields, add required parameters, modify response shapes. Each change moves the contract the harness was built against.
The clearest public incident is the n8n schema drift event in February 2026. An upgrade from v2.4.7 to v2.6.3 changed how tool schemas were generated, and the new output was rejected by both OpenAI and Anthropic API endpoints. Enterprise workflows running production agent jobs stopped working entirely. The only short-term fix was rolling back the version. Nobody caught it before it hit production because the harness’s tool-schema layer was not on the regression eval suite.
The Replit July 2025 postmortem is a different angle on the same problem. An agent given full autonomy made a confident wrong decision that cascaded through the workflow. The MCP standard introduced by Anthropic in late 2024 solved tool connectivity but not coordination. A common production pattern is an agent that calls a tool, gets back a response shape it wasn’t designed to handle, and loops indefinitely consuming tokens. The growing MCP-server ecosystem magnifies this surface: every additional connected tool adds an independent contract that the harness depends on.
The footprint is the most distinctive of the four drivers. One slice tanks while the rest stay flat. A harness with 30 tools wired up has 30 independent decay clocks running in parallel. The fix is to pin tool versions in production deployments and to put each tool’s contract on the reference suite. Most teams don’t, and that is where the silent failures live.
4. Internal aging
The fourth driver is the harness aging itself. Every incident handled in production typically adds a branch, a new validator, a new override, a new edge-case handler. Over time these accumulate. The harness gets brittle in a different sense: it works, but each new component costs more to add than the last, and the testing surface grows faster than the team can maintain.
The quantitative evidence is striking. Vercel’s December 2025 post on removing 80% of their agent’s tools reports success rates climbing from 80% to 100%, with token use cut by more than half and latency dropping from roughly 724 seconds to 141 on the same model with harness-only changes. LangChain’s TerminalBench result improved from 52.8 to 66.5 on the same base model with harness-only changes. A practitioner survey reports that production-quality harnesses get rewritten multiple times: Manus rewrote five times, LangChain four. Industry surveys put the enterprise AI agent project failure-to-production rate at as much as 88%, and the dominant failure pattern is rarely a model gap.
The footprint is a continuous gradual descent that doesn’t coincide with any external event. The fix is harder than the others. Stop patching, plan a rebuild. The rule of thumb across teams that have done this multiple times is to build harness components to be deleted, not preserved.
What to tell your customer
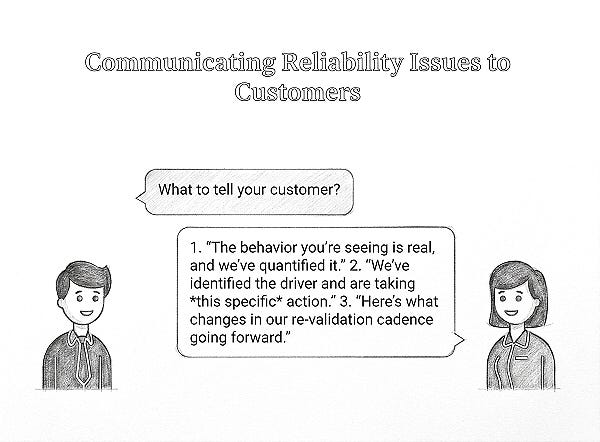
When the reliability score crosses the tripwire and a customer is involved, the communication script is short. Three messages, in order.
“The behavior you’re seeing is real, and we’ve quantified it.”
Sharing the reliability score is the fastest way to convert a vague customer report into a tractable engineering item.
“We’ve identified the driver and are taking this specific action.”
Naming which of the four drivers moved (model upgrade, inference swap, tool drift, internal aging) and the rollback or patch being applied turns the conversation from “your AI is broken” into “you have a process.”
“Here’s what changes in our re-validation cadence going forward.”
Tightening the cadence after a tripwire crossing is the visible discipline that resets customer trust. “We’ll watch it” is not enough.
This is the field-level reason the Harness Half-Life discipline exists. The curve is not for the team’s quarterly metrics. It is for the customer call that is coming.
When the tripwire doesn’t bite
Harness Half-Life matters most when decay drivers are moving. There are regimes where the reliability score barely descends, and the literature is honest about that. Scale AI’s SWE-Atlas reported that for some model families harness choice did not produce statistically meaningful differences. METR’s benchmarks show some coding-agent harnesses do not consistently outperform a basic scaffold.
Translated to operations: if the team’s tooling is mature and slow-changing, the model is pinned to a long-deprecation version, and the production distribution is narrow, the curve will descend slowly. Re-validation can be deferred. But teams should measure to find out, not assume. A flat curve is a finding, and earning the right to relax the cadence requires data.
The Retrofit Tax when the rebuild comes
When the tripwire crosses and a rebuild is on the table, the cost of the rebuild is not just engineering hours. The canonical Retrofit Tax in the MRE arc breaks the cost into three compounding components: workflow debt (orchestration logic and prompt templates tuned for the old model’s failure modes that misbehave on the new model), schema opacity (input and output shapes that were stable on the old model but produce inconsistent shapes on the new model, breaking downstream consumers), and governance friction (audit, compliance, and approval surfaces that were certified against the old model’s behavior and must be re-certified).
The Retrofit Tax is what makes a model upgrade non-zero-cost even when the new model is strictly better. Teams underestimate it because they assume “the model is better → my system is better”; the harness is the missing variable. When the rebuild is calibrated against the Harness Half-Life signal - early, while the harness is in the yellow zone rather than the red, the Retrofit Tax is bounded. When the rebuild is forced by a customer incident in the red zone, the tax compounds.
FAQ
What is the minimum viable Harness Half-Life setup?
100 prompts in a frozen suite, stratified across the four driver footprints (refusals, structured outputs, tool calls, multi-turn flows). Weekly re-runs. A tripwire at 0.90. Grow the suite once the discipline is running. The full version is 500 to 2,000 prompts with 70% sampled from anonymized production traffic and 30% authored edge cases.
How does this differ from the per-component “harness half-life” framing?
The per-component framing addresses component-by-component obsolescence driven by model improvement. Each harness component has its own duration before becoming unnecessary. The whole-harness Harness Half-Life framework in this piece addresses the aggregate behavioral effectiveness across four independent decay drivers, of which model improvement is one. The two views are complementary: per-component half-lives feed the aggregate reliability-score curve.
How does Harness Half-Life work for multi-tenant harnesses?
Per-tenant reliability scores. Each tenant has a different production distribution and likely different downstream tools, so each tenant has its own decay rate. The aggregate curve hides the worst-affected tenants, which is usually the wrong thing to optimize. Multi-tenant production agents need a per-tenant reliability dashboard plus an aggregate, not just an aggregate.
Why do teams miss this?
The failures look like model regressions. When an agent that worked last month breaks this month, the natural assumption is the model changed. Usually the model did change, but it changed alongside one or two other drivers, and the tolerance budget was already depleted. Without a reliability-score curve, the team cannot tell which driver actually moved.
Where does Harness Half-Life sit in Model Reliability Engineering?
Inside the Harness Engineering pillar, alongside the construction-side discourse that the industry has already named. Context Engineering governs what the model knows; Harness Engineering governs what surrounds the model; Harness Half-Life is the measurement that tells the team how long what surrounds the model continues to behave as validated. Together they cover both sides of the model in production.
The on-call playbook
Reliability score crosses tripwire?
  YES → continue. NO → snooze.

Match the drop to a calendar event (model release, tool changelog, infra change)?
  YES → that is your driver. Re-validate against the change. Done.
  NO → continue.

Slice the score by category. Which slices moved?
  Refusals or structured outputs → model upgrade (silent, no release announcement)
  One tool slice → tool / schema drift on that tool
  Many slices, small movements each → inference-stack swap
  Everything gradual, no event → internal aging

Roll back the suspected source. Re-run the failing prompts.
  PASSING → driver confirmed. Re-validate or patch.
  FAILING → run A/B against reference FP16 inference. Token diff identifies the layer.

Document the driver, the action, and the new cadence. Tell the customer.
The agent that worked last month is not the agent that is running today. The only field-level question is whether the team is measuring how far it has moved, and the only customer-level question is whether the team caught it first.